Chart Pack: 2026-05-17
Big Picture Thinking, One Chart At A Time
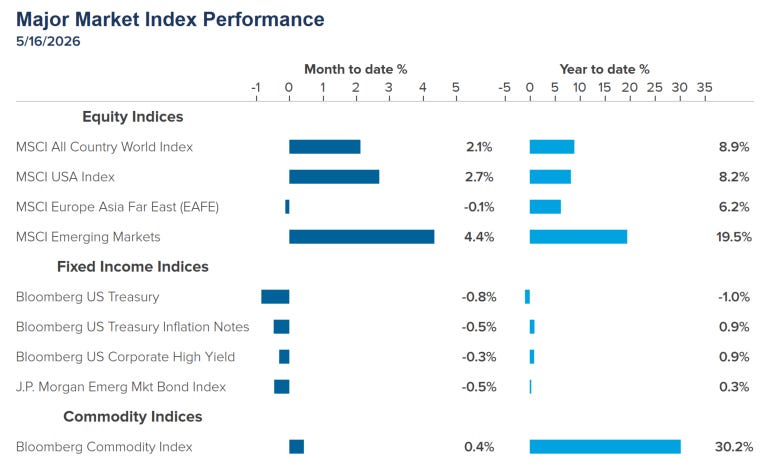
Financial Markets
This Week in Macro
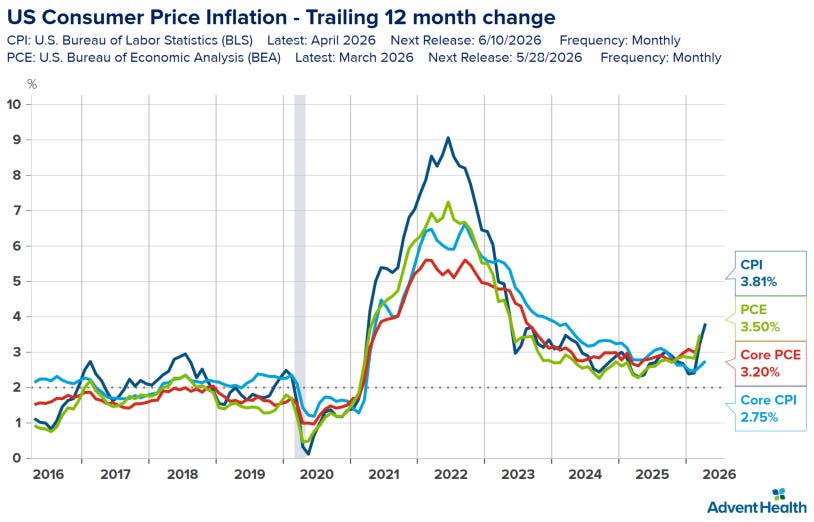
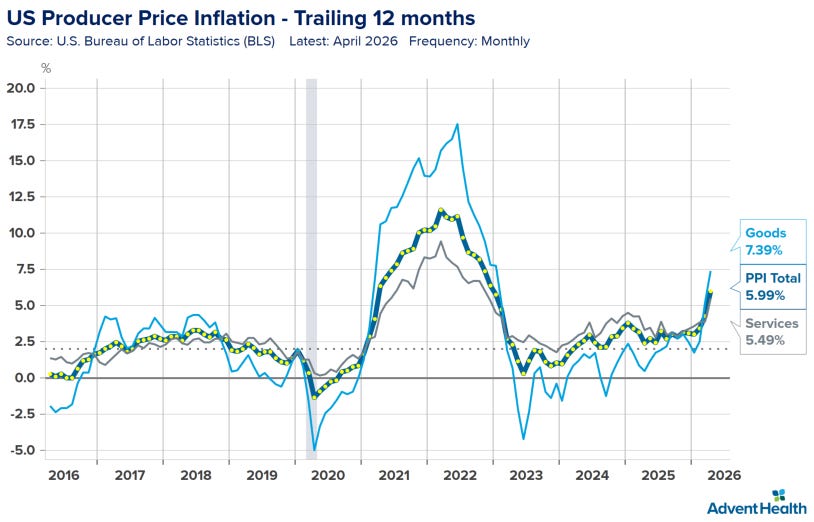
US Inflation
The Data: Both the Consumer Price Index (CPI) and the underlying Producer Price Index (PPI) continue to show trend increases to levels that show an economy with rising costs.
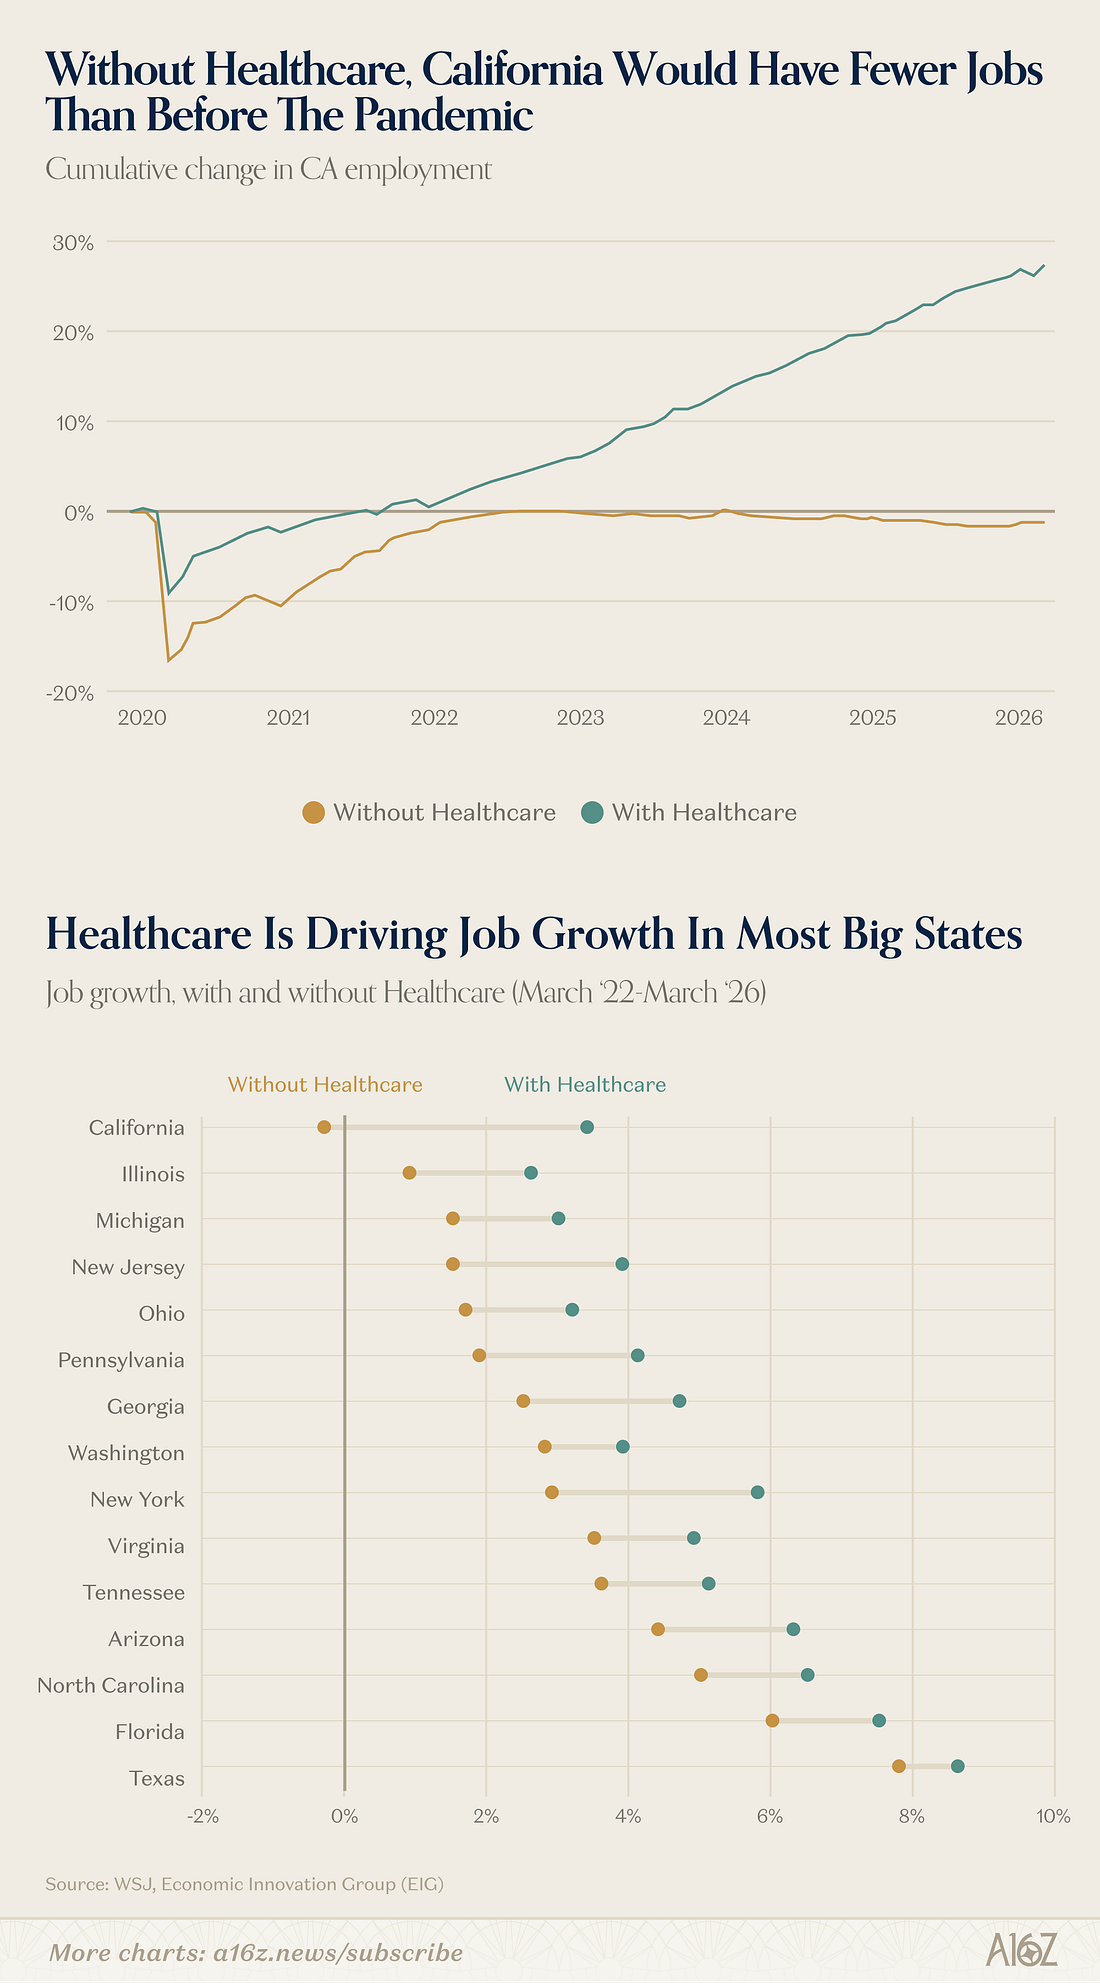
Healthcare’s Critical Role in Job Growth
The Data: California’s employment would be below pre-pandemic levels without the healthcare sector’s contribution.
Why It Matters: This underscores healthcare’s essential role in economic stability and job creation, influencing workforce dynamics and state policy priorities.
Eldercare Employment Surge
The Data: Employment in eldercare services has increased significantly across the U.S., with New York and New Jersey showing the highest growth at 56%.
Why It Matters: This trend indicates a growing demand for eldercare services, which may drive investment and resource allocation in healthcare sectors focused on aging populations.

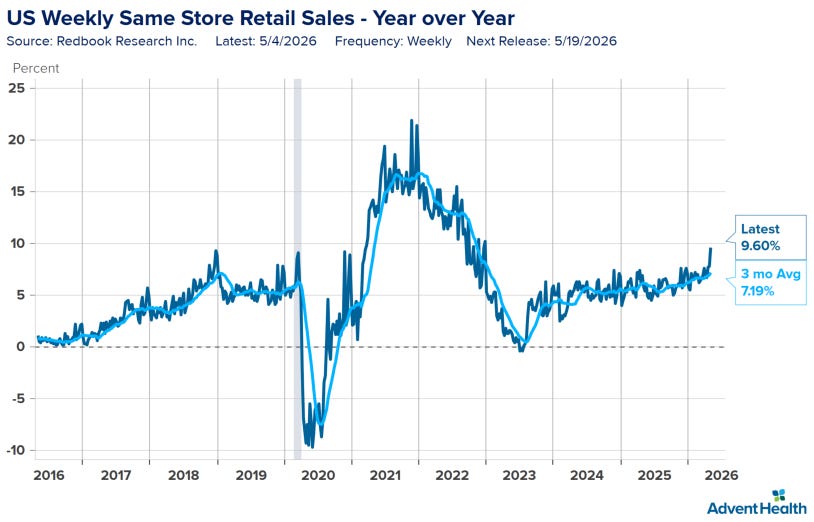
Retail Sales
The Data: Despite rising inflation, consumers are spending at a higher rate than last year at this time.
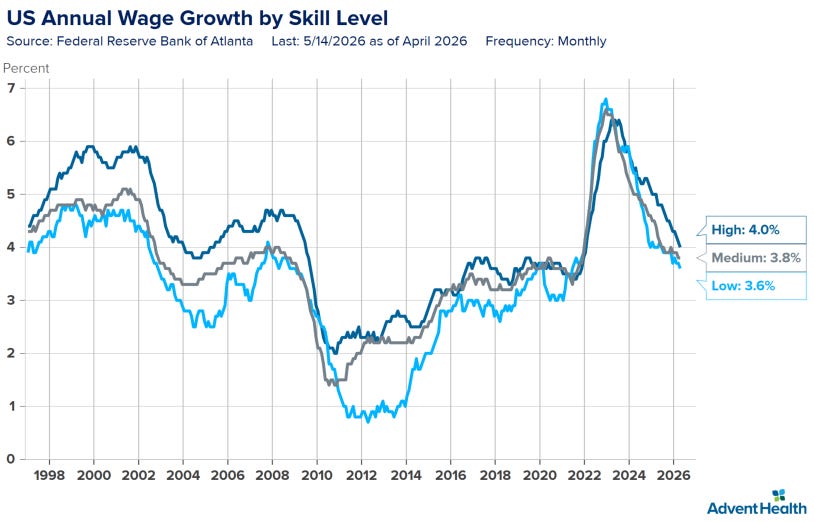
Wage Growth
The Data: The rate of labor cost increases continues to fall across pay levels.
Other Economics
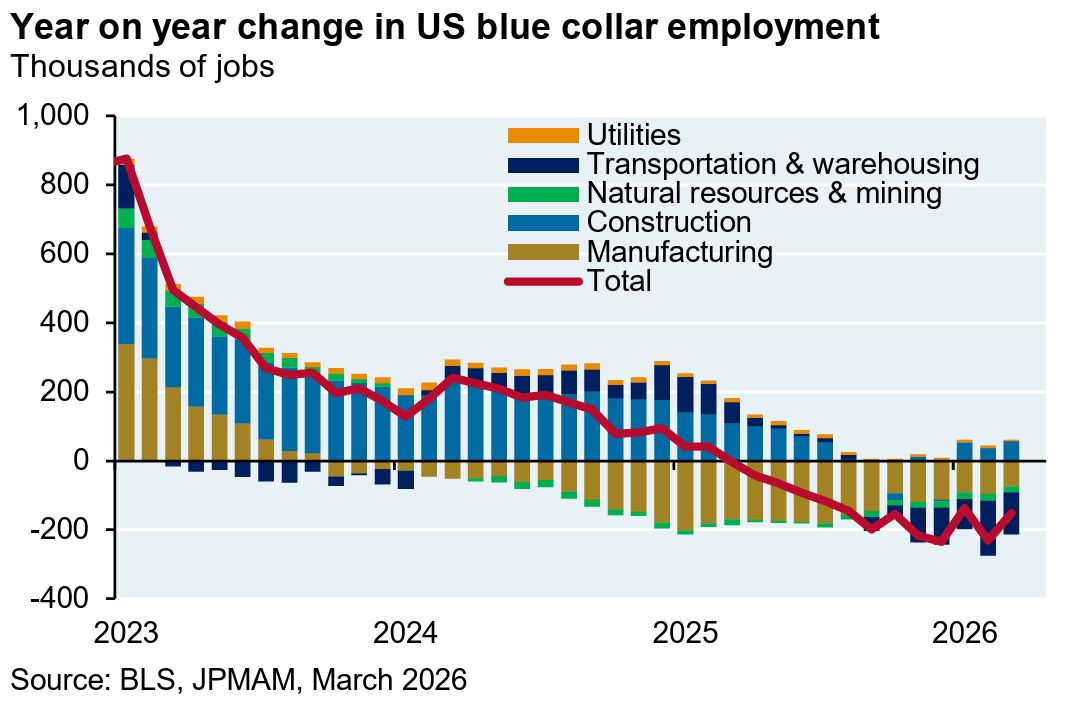
Decline in US Blue Collar Employment
The Data: US blue-collar employment shows a significant downward trend, with total jobs decreasing year-on-year starting in 2024.
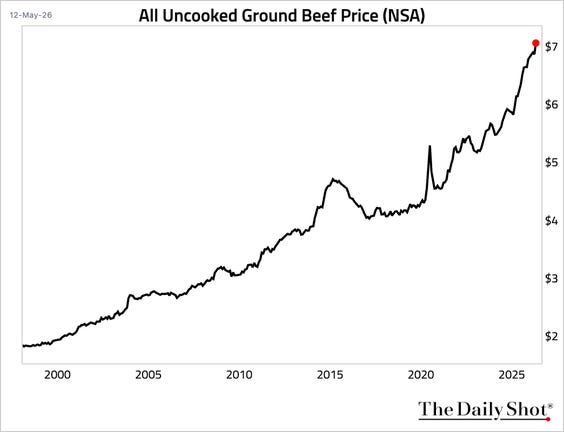
Rising Ground Beef Prices
The Data: The price of uncooked ground beef has surged to over $7 per pound, marking a significant increase since 2020.
Why It Matters: This price escalation reflects broader inflationary pressures in the food sector, impacting consumer spending and food supply chain dynamics.
Shift in Global Trade Partnerships
The Data: In 2025, China is the primary trading partner for a majority of countries, compared to the USA in 2000.
Why It Matters: This shift signals a significant realignment of global supply chains, affecting trade dynamics and economic dependencies.

Stock Markets
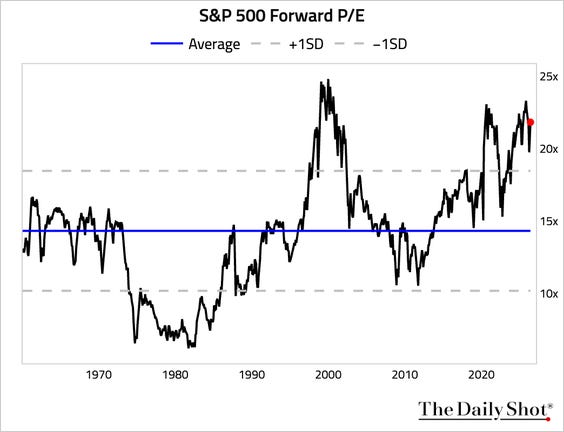
S&P 500 Forward P/E Ratio Approaches Historical Highs
The Data: The S&P 500 forward price-to-earnings ratio is currently above 20, nearing levels last seen during market peaks.
Why It Matters: This elevated valuation suggests potential market vulnerability, as high P/E ratios often precede corrections when earnings growth does not keep pace.
Interest Rates
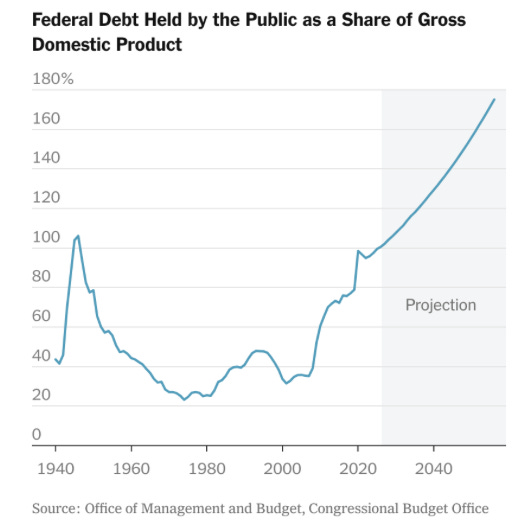
Rising Federal Debt as GDP Share
The Data: Federal debt held by the public is projected to exceed 160% of GDP by 2040.
Why It Matters: This trajectory indicates significant long-term fiscal pressure, potentially limiting government spending flexibility and impacting economic growth.
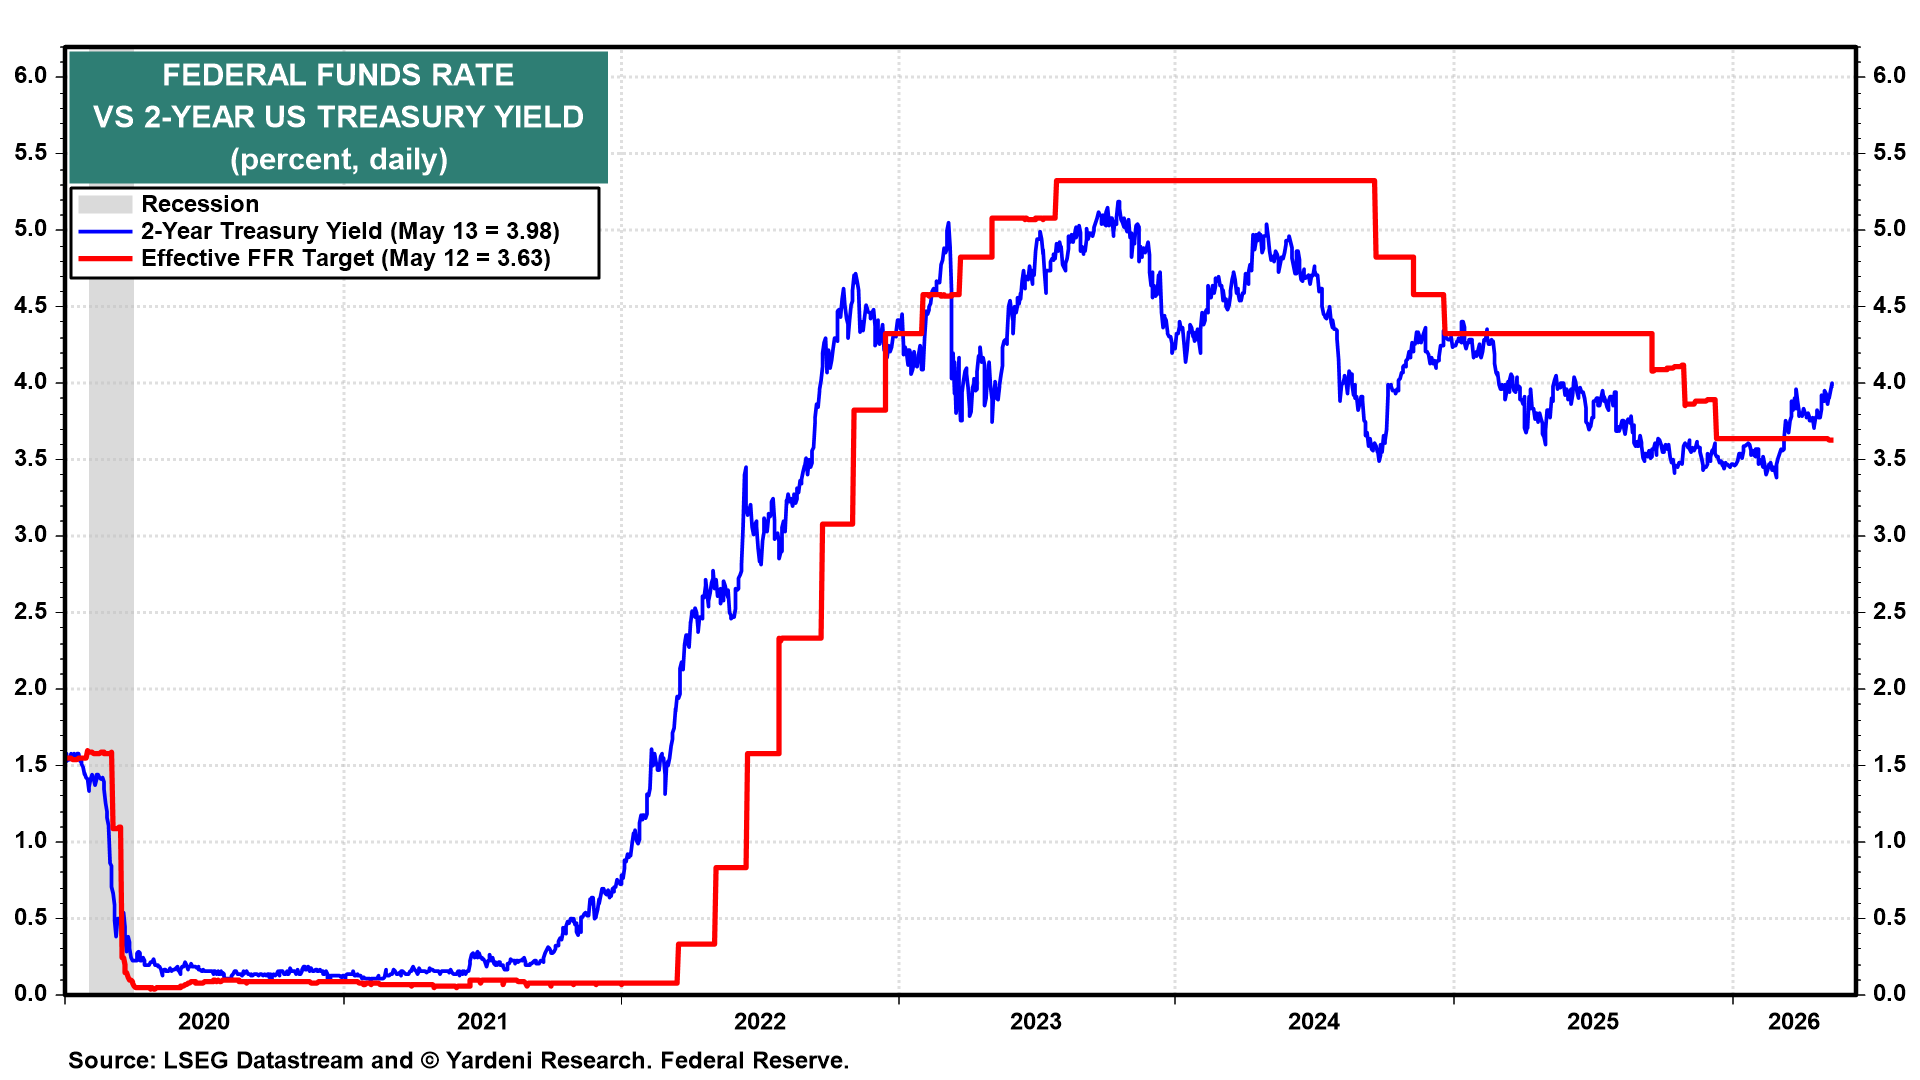
Yield Curve Dynamics
The Data: The 2-year US Treasury yield is currently higher than the effective federal funds rate, indicating that the market believes that short rates are too low to curb inflation.
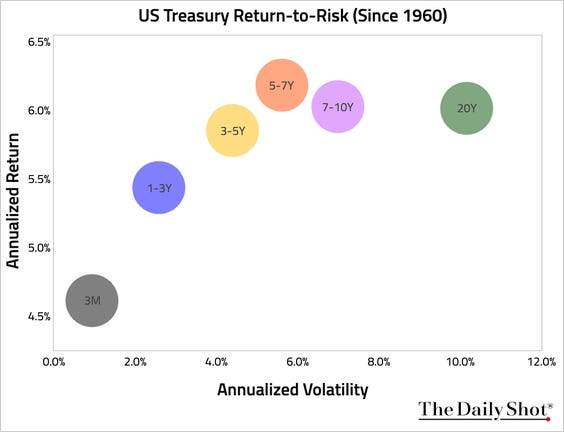
US Treasury Return-to-Risk Dynamics
The Data: The best return to risk dynamics in US Treasury issues since 1960 has been in the 3-10 year sector of the maturity curve.
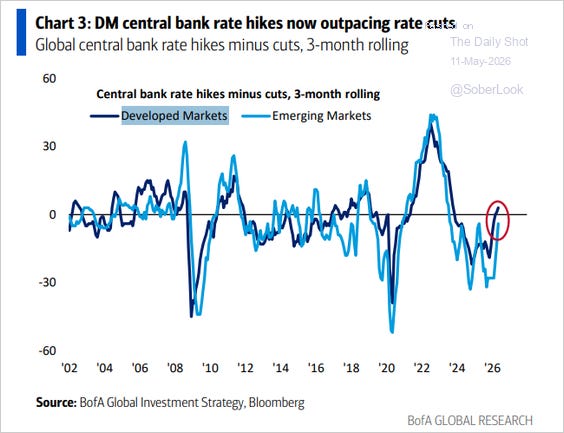
Developed Markets Lead in Rate Hikes
The Data: Developed markets are currently experiencing a higher frequency of central bank rate hikes compared to rate cuts, as indicated by the rolling three-month data.
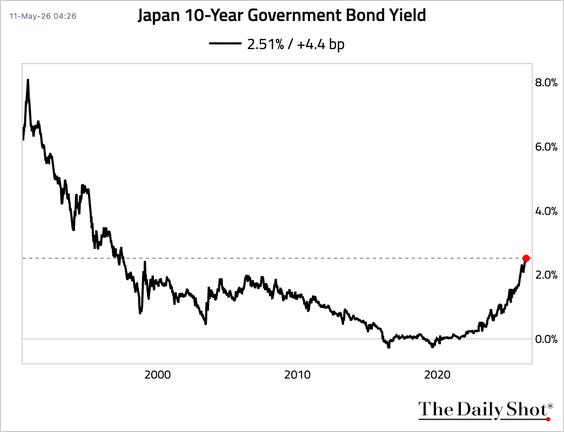
Surge in Japan’s 10-Year Government Bond Yield
The Data: Japan’s 10-year government bond yield has risen sharply to 2.51%, the highest level since 1997.
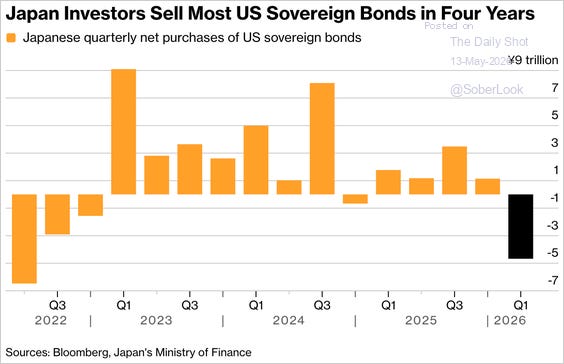
Japan’s Significant US Bond Sell-Off
The Data: Japanese investors have sold US sovereign bonds at the highest rate in four years, with net sales reaching nearly 3 trillion yen in Q1 2026.
Why It Matters: This trend indicates a shift in Japanese investment strategy, potentially impacting US bond yields and market liquidity.
Credit Markets
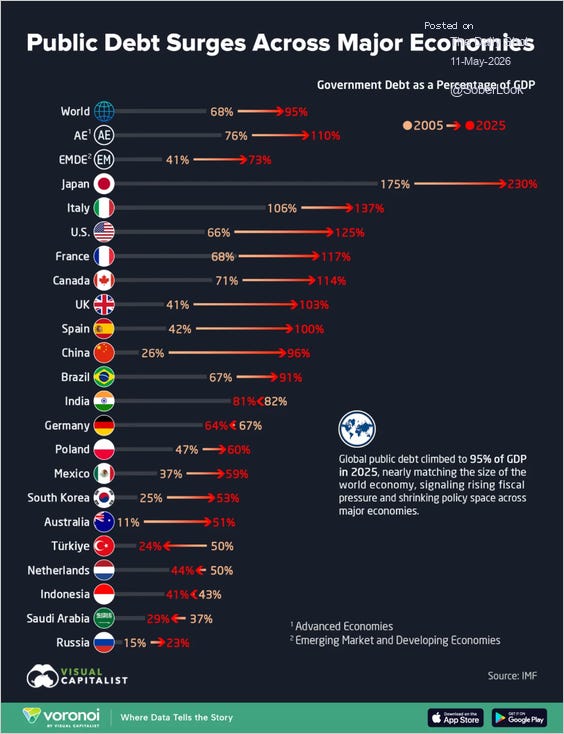
Surge in Global Public Debt
The Data: Global public debt reached 95% of GDP by 2025, up from 68% in 2005.
Why It Matters: This increase indicates significant fiscal pressure on governments, limiting their ability to respond to economic challenges.
Commodities
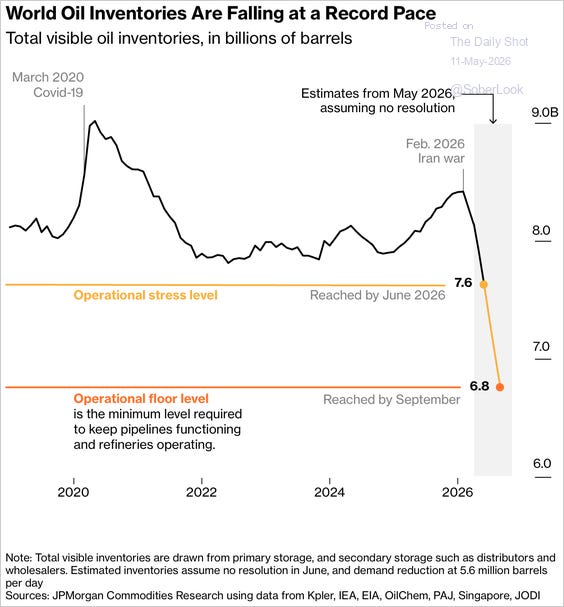
Global Oil Inventories Declining Rapidly
The Data: Total visible oil inventories are projected to fall to 6.8 billion barrels by September 2026, below the operational floor level.
Climate
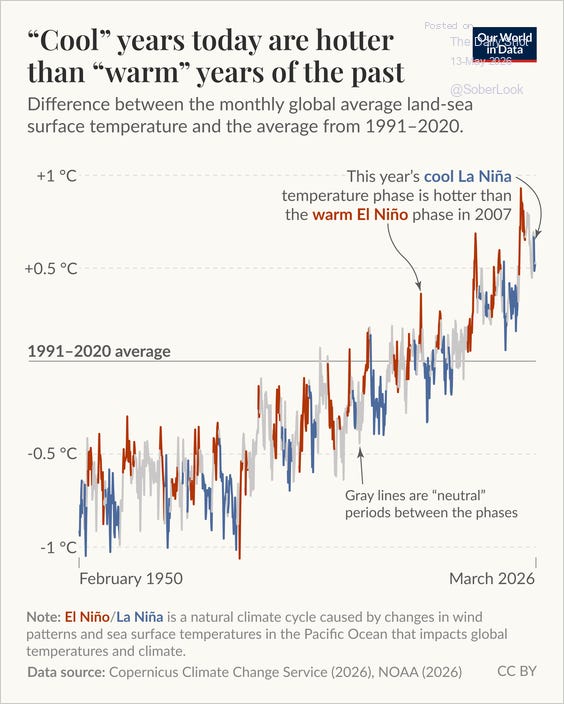
Current Cool Years Exceed Past Warm Years
The Data: Recent cool La Niña phases show higher global average land-sea surface temperatures than previous warm El Niño years.
Why It Matters: This trend indicates a persistent increase in baseline temperatures, affecting climate patterns and potentially intensifying weather-related risks.
China’s Electricity Generation Surge
The Data: In 2025, China’s electricity generation increased by almost 500 TWh, primarily from solar and wind sources. This annual increase for China is as much power as exists in Germany.

AI / Technology
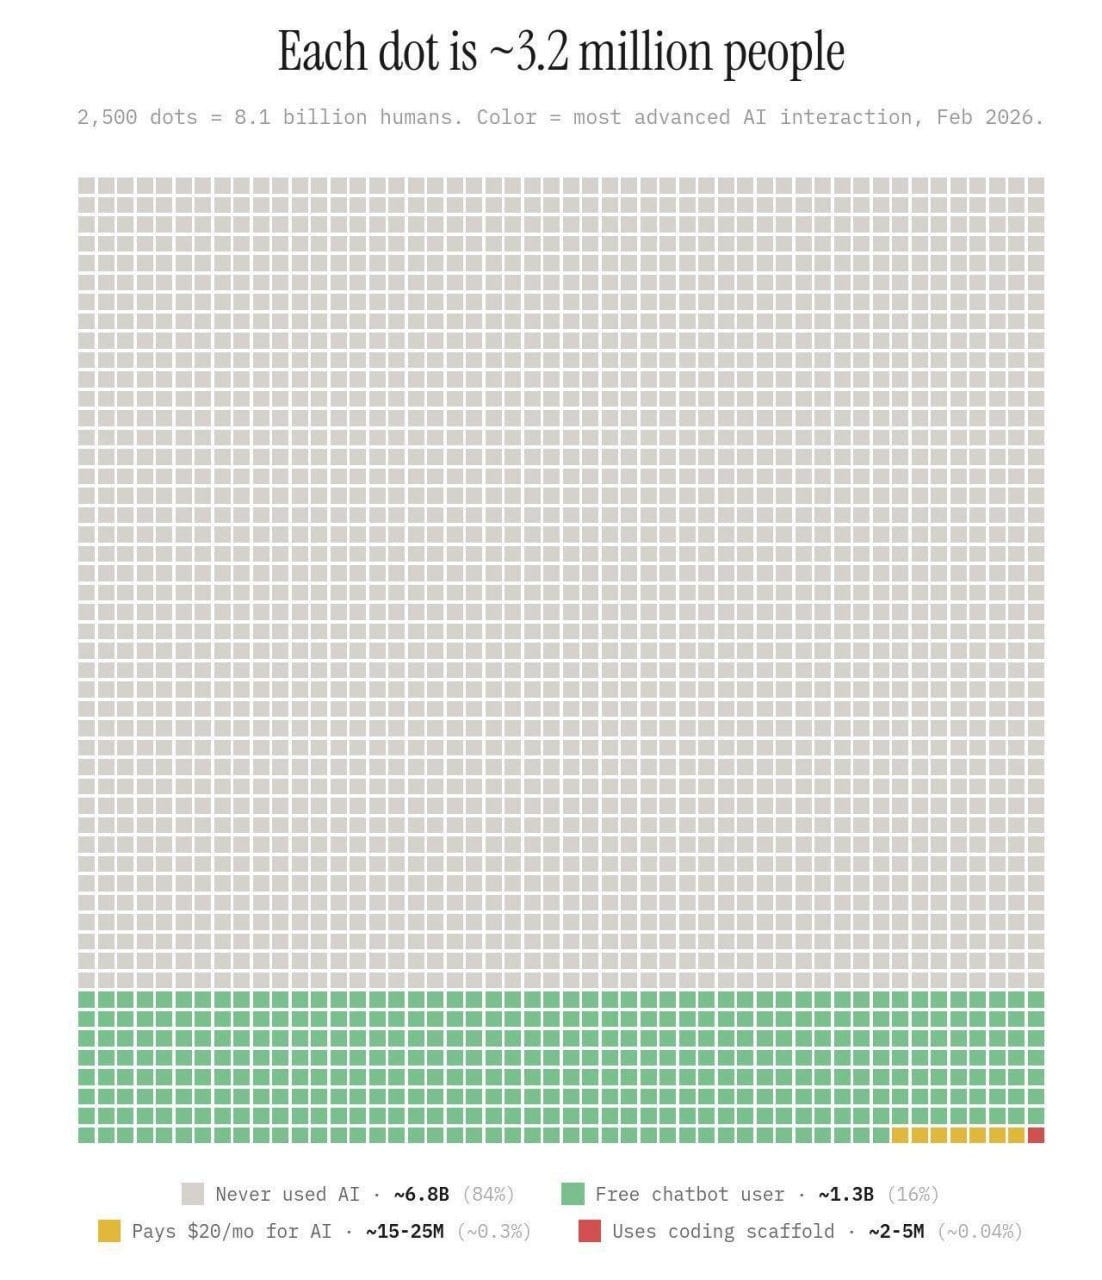
Global AI Interaction Distribution
The Data: Approximately 6.8 billion people have never used AI, representing 84% of the global population.
Why It Matters: We are still VERY early in the AI adoption journey.
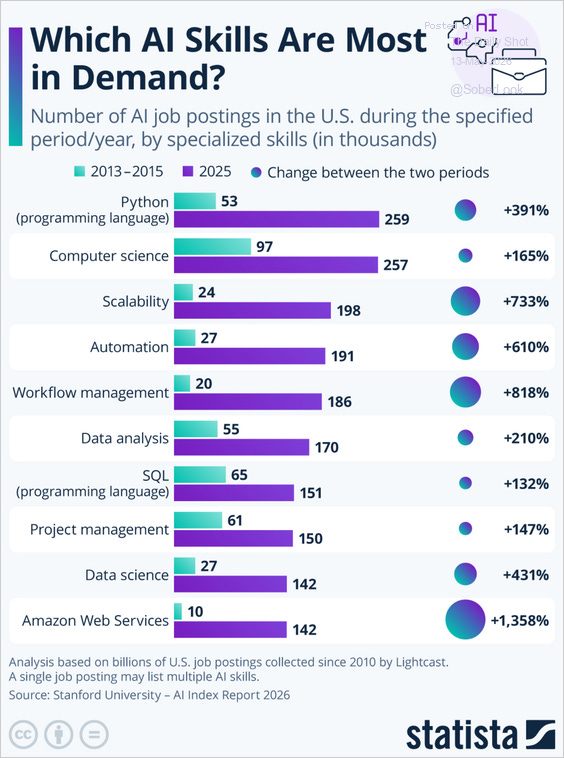
Surge in Demand for AI Skills
The Data: AI job postings in the U.S. have dramatically increased, with Python and Amazon Web Services seeing the highest growth rates at 391% and 1,358%, respectively.
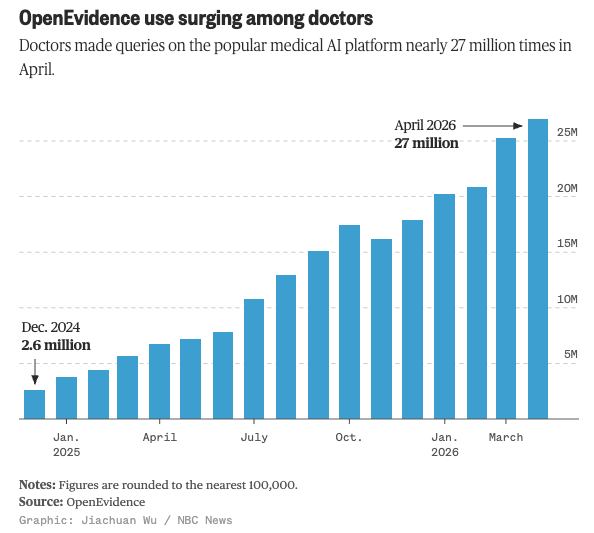
Surge in Medical AI Queries
The Data: Doctors made nearly 27 million queries on the OpenEvidence platform in April 2026, a significant increase from 2.6 million in December 2024.
Why It Matters: This rapid adoption indicates a shift towards AI-driven decision-making in healthcare, potentially enhancing efficiency and patient outcomes.
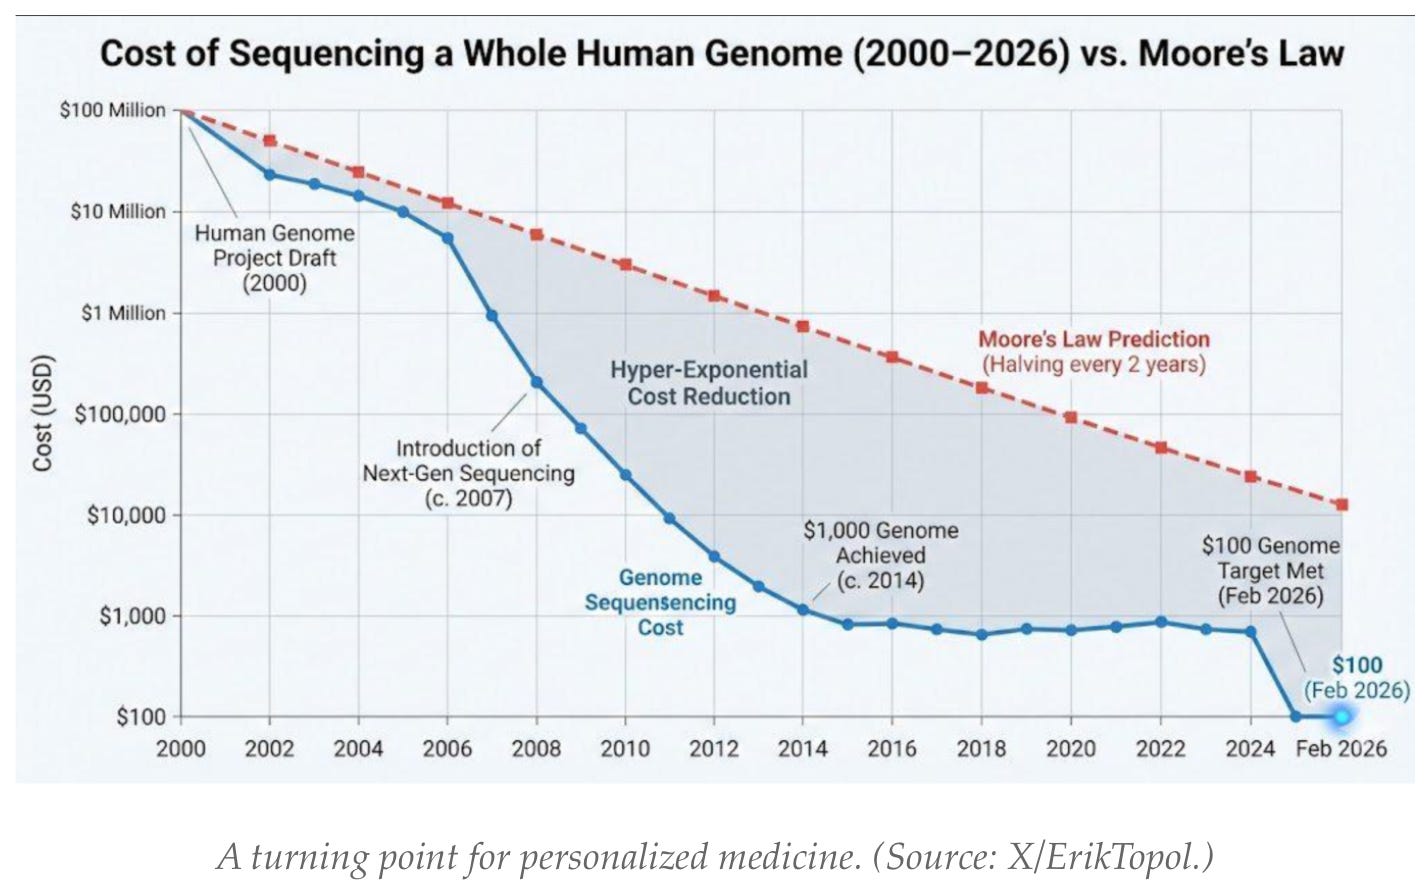
Dramatic Cost Reduction in Genome Sequencing
The Data: The cost of sequencing a whole human genome has decreased from nearly $100 million in 2000 to a projected $100 by February 2026.
Why It Matters: This reduction enables broader access to personalized medicine, potentially transforming healthcare delivery and patient outcomes.
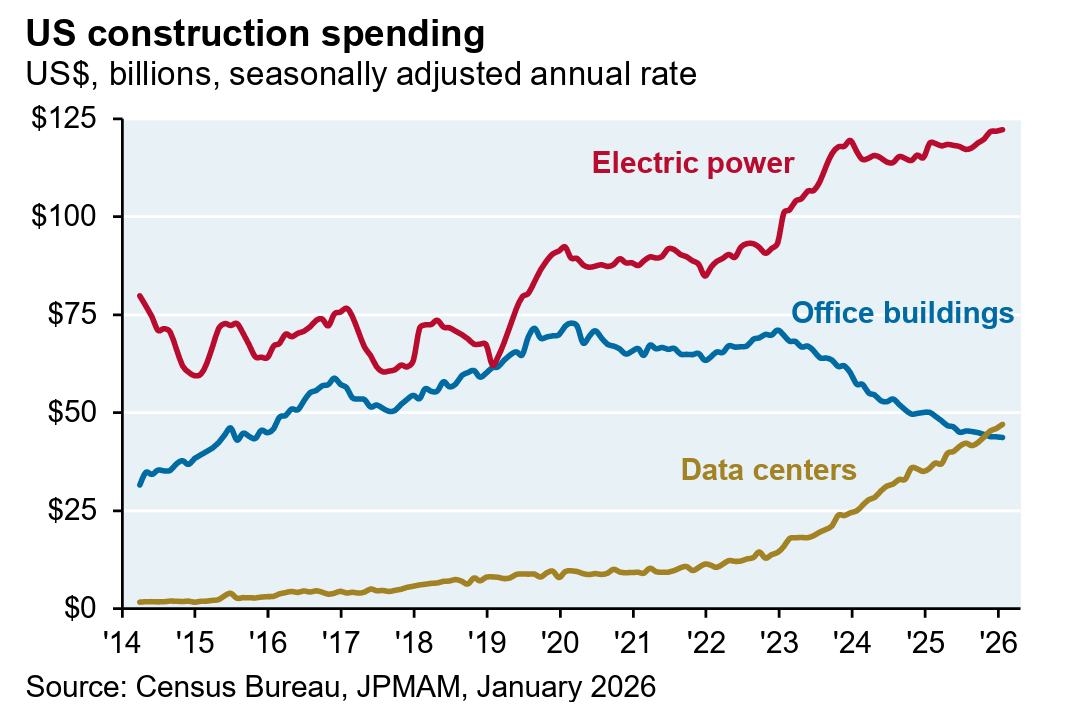
Shifts in US Construction Spending
The Data: US construction spending shows a significant increase in electric power investments, while spending on office buildings remains stagnant, and data centers see accelerating growth.
Why It Matters: The rising investment in electric power indicates a strategic pivot towards energy infrastructure, reflecting changing demand dynamics and potential shifts in resource allocation.
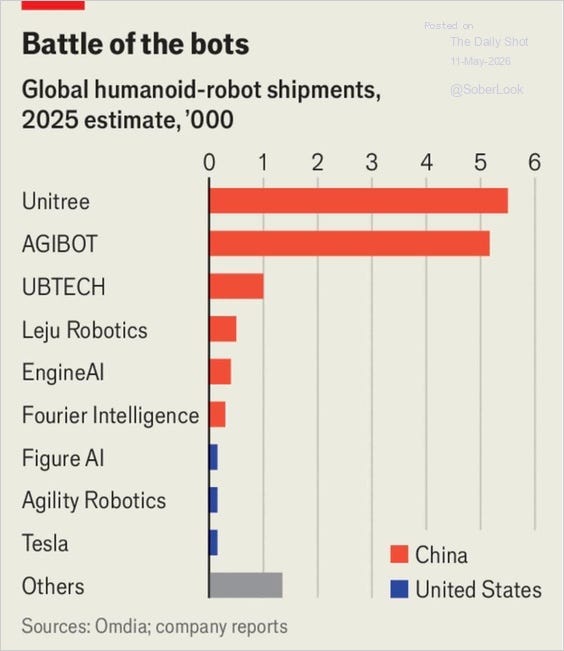
Dominance in Humanoid Robot Shipments
The Data: China’s leading companies, particularly Unitree and AGIBOT, dominated global shipments of humanoid robots in 2025.
Why It Matters: This concentration of production in China may reshape global supply chains and influence competitive dynamics in robotics technology.
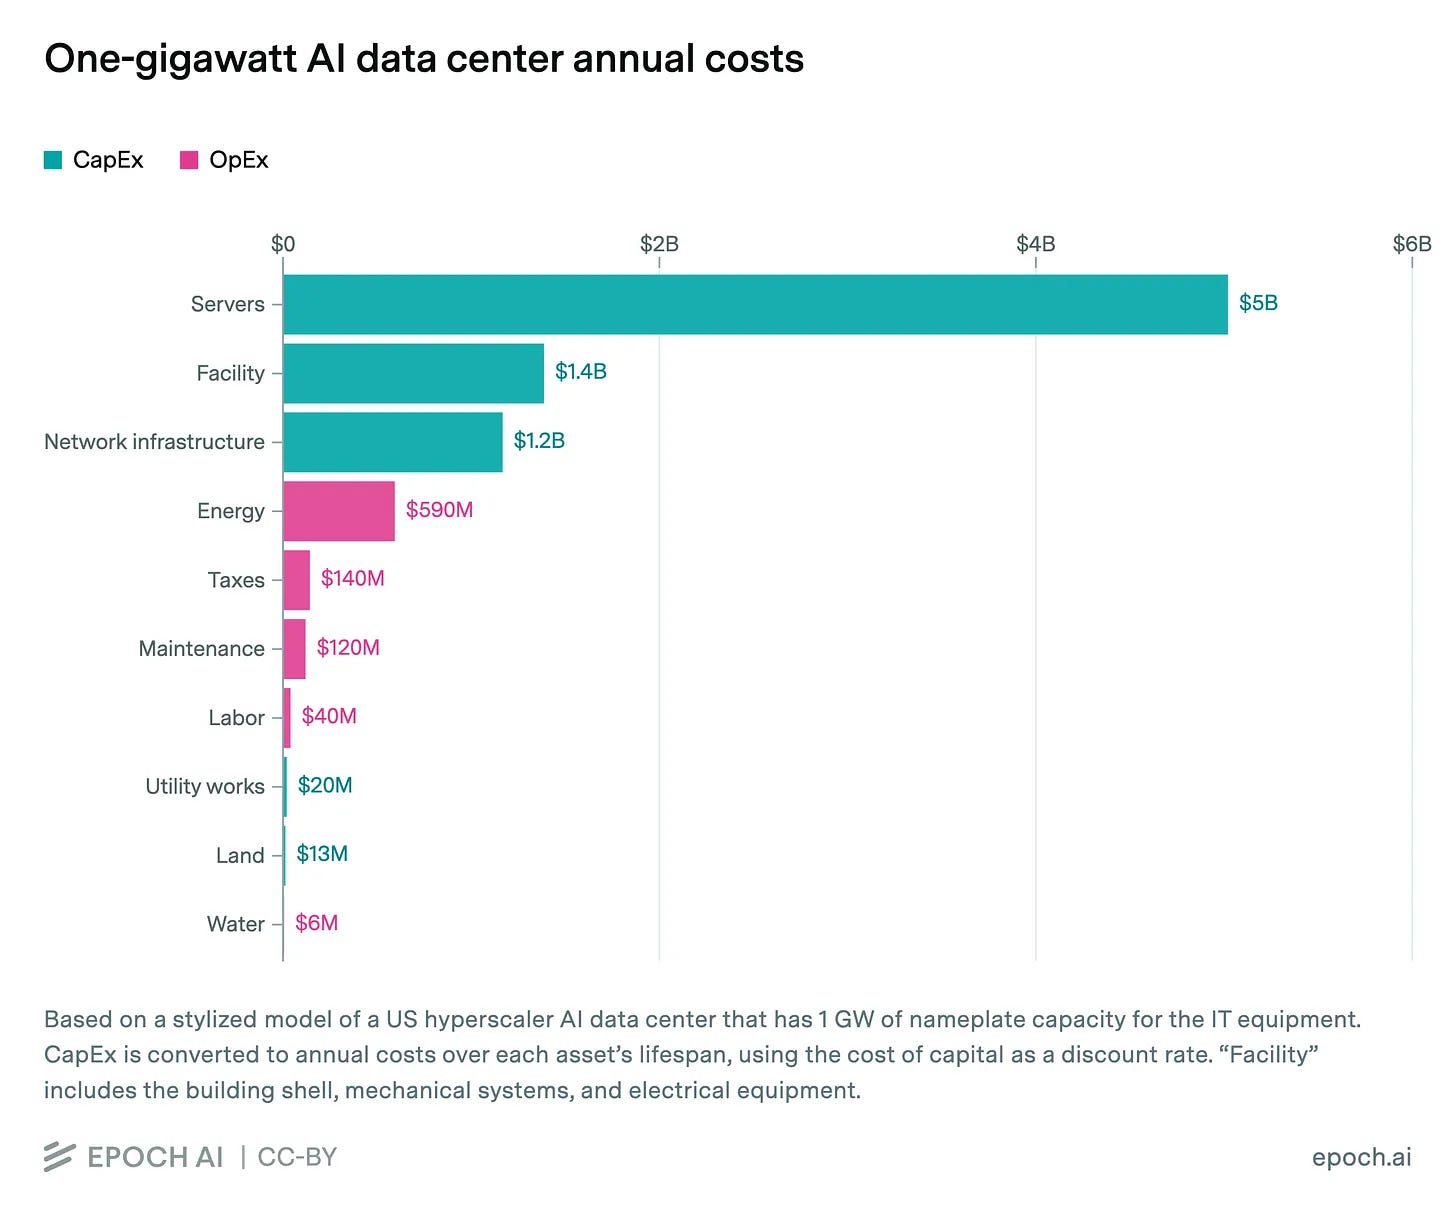
Annual Costs of One-Gigawatt AI Data Center
The Data: The total annual operating cost for a one-gigawatt AI data center is approximately $5 billion, with server and facility costs accounting for the majority.
Why It Matters: Understanding these costs is crucial for businesses investing in AI infrastructure, as it highlights the significant capital and operational expenditures necessary for scalability.
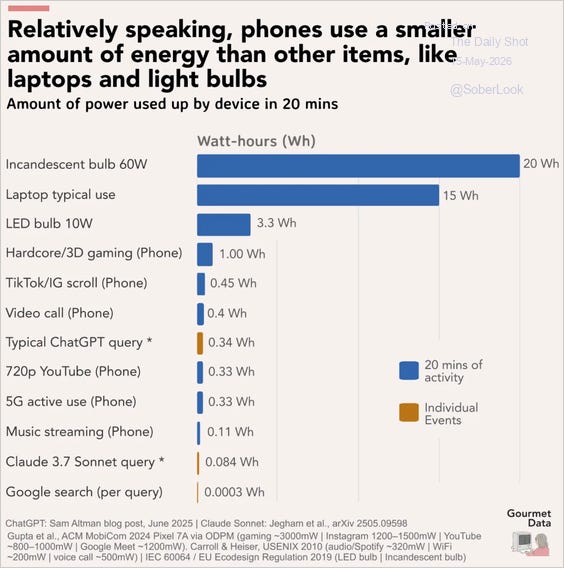
Phones Use Less Energy Than Other Devices
The Data: In 20 minutes, a typical phone usage consumes significantly less power than laptops and incandescent bulbs, with only 0.4 to 3.3 watt-hours compared to 15 watt-hours for a laptop and 20 watt-hours for a bulb.
Why It Matters: This energy efficiency highlights the growing role of mobile devices in reducing overall energy consumption, impacting sustainability strategies in both consumer behavior and corporate policies.
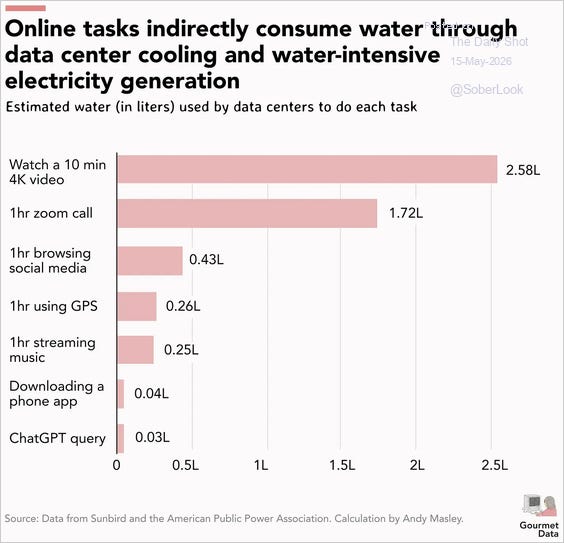
Water Consumption of Online Tasks
The Data: Watching a 10-minute 4K video consumes 2.58 liters of water through data center operations.
Why It Matters: This highlights the significant environmental impact of digital activities, prompting businesses to reconsider resource management and sustainability strategies.
Other Interesting Charts
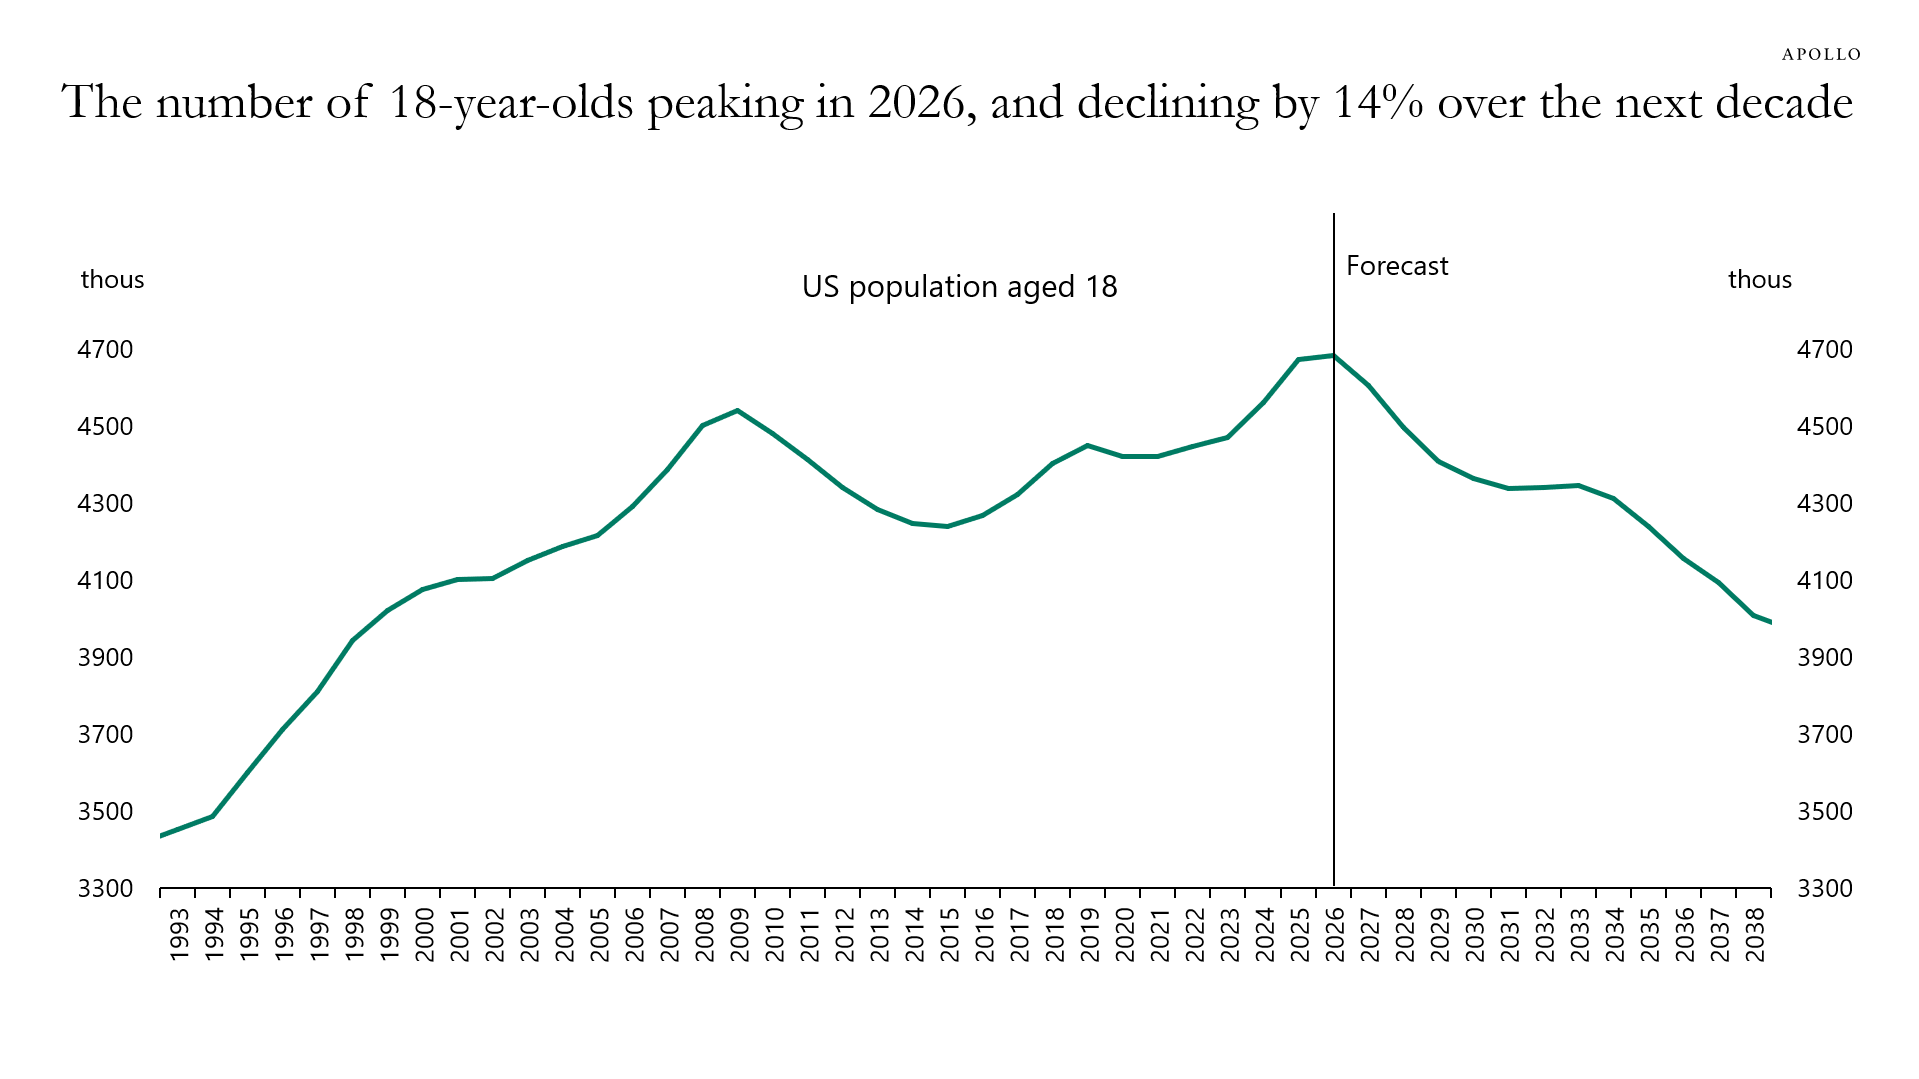
Decline in the US 18-Year-Old Population
The Data: The number of 18-year-olds in the US is projected to peak at 4.7 million in 2026, then decline by 14% over the following decade.
Why It Matters: This demographic shift will impact sectors reliant on young adults, such as education and consumer markets, potentially leading to reduced demand and shifts in resource allocation.
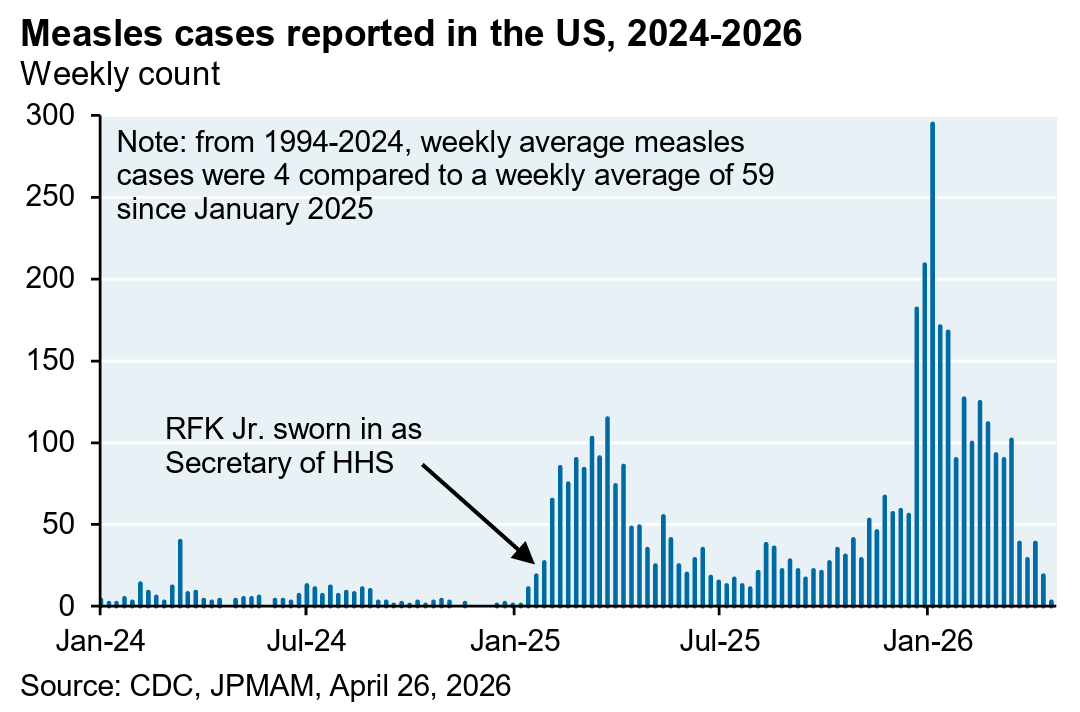
Surge in Measles Cases Post-2024
The Data: Weekly measles cases in the US spiked significantly starting in January 2025, with averages reaching 59 compared to just 4 from 1994 to 2024.
Why It Matters: This increase signals potential public health challenges and underscores the need for renewed vaccination efforts to prevent outbreaks.
Decline in Property and Violent Crimes
The Data: Property and violent crimes per 100,000 people have steadily decreased from 2001 to 2020, with a notable drop in 2020.
Why It Matters: This trend may influence public policy and resource allocation in law enforcement and community safety initiatives.

Republicans Hold Majority of Governorships
The Data: Republican governors lead in 26 states, compared with 24 led by Democrats, as of May 7, 2026.

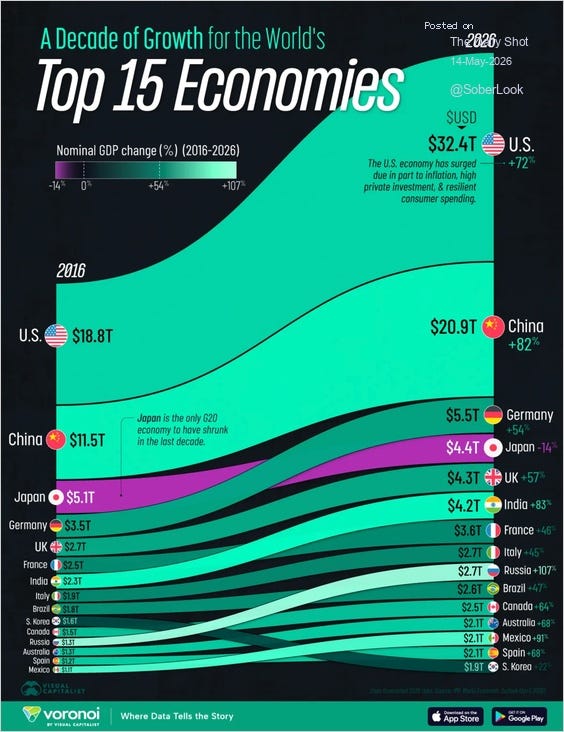
Growth Trends Among Top Economies
The Data: From 2016 to 2026, the U.S. and China saw significant nominal GDP increases, with the U.S. at $32.4 trillion and China at $20.9 trillion.
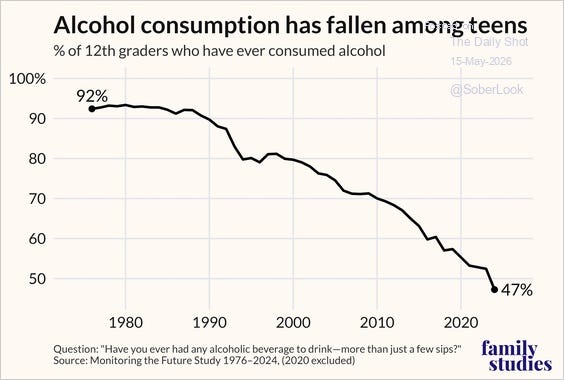
Decline in Teen Alcohol Consumption
The Data: The percentage of 12th graders who have ever consumed alcohol has decreased from 92% in 1980 to 47% in 2020.
Why It Matters: This significant decline indicates shifting social norms and could impact industries reliant on youth alcohol consumption.